Ask three sources what San Rafael home prices did this year and you'll get three answers that don't agree with each other. Redfin's city page had the median sale price up 24.9% year over year in February 2026. Zillow's home value index showed the typical home worth roughly flat, up just 0.4% over the same twelve months through the end of June. A third tracker had the median actually dip 2.4% from February to March. None of these sources made an error. They're all measuring the same city and getting different stories because San Rafael isn't one market wearing one price tag. It's several markets that happen to share a zip code, and the citywide median is just whichever one sold the most that month.
That distinction matters if you're comparing San Rafael to other Marin towns on the strength of a single number. The number moves for reasons that have nothing to do with whether homes are getting more or less expensive.
Three Reports, One Confused Number
Look closer at the monthly data and the disagreement gets sharper, not clearer. One local market report tracked San Rafael's median sold price per square foot sliding for three straight months in 2026: $844 in April, $808 in May, $779 in June. That's a real, consistent trend inside one measure. But the same report noted that of the 45 homes sold that June, 28 received multiple offers and 23 sold above asking, which sounds like a market getting hotter, not cooler. And in that same window, North San Rafael logged 23 sales against South San Rafael's 22, a near-even split hiding inside a single citywide count.
Read those three data points together and the contradiction resolves. Price per square foot fell because the mix of what sold shifted, likely toward larger homes that cost less per foot even at a higher sticker price. Multiple offers stayed strong because certain pockets are still moving fast. And the north-south split shows the city's aggregate number was never one market to begin with. It was two markets, at minimum, averaged into a single line.
The Spread Underneath the Average
The clearest way to see this is to stop looking at the city and look at its named neighborhoods. Here's what Redfin's own neighborhood pages and a separate Redfin-sourced pricing analysis showed across San Rafael's sub-markets in the first half of 2026:
| Neighborhood | Median Sale Price | Window |
|---|---|---|
| Terra Linda | $682,500 | March 2026 |
| North San Rafael | $970,000 | February 2026 |
| Gerstle Park | $1,142,116 | May 2026 |
| San Pedro Peninsula | $1,687,500 | February 2026 |
| East San Rafael | $1.6 million | trailing 3 months (through ~June 2026) |
| Dominican/Black Canyon | ~$1.9 million | March 2026 |
| Peacock Gap | ~$2.15 million | March 2026 |
That's better than a 3x spread, inside one city, in roughly the same stretch of the calendar. A buyer who anchors on "San Rafael's median is around $1.3 million" and then goes shopping in Terra Linda will find that number describes almost nobody's actual transaction there. The same buyer shopping Peacock Gap will find the citywide median describes a home that barely exists in that neighborhood's inventory.
Why the Gap Is Structural, Not Random
The spread isn't noise. It tracks directly to what actually got built in each pocket and when.
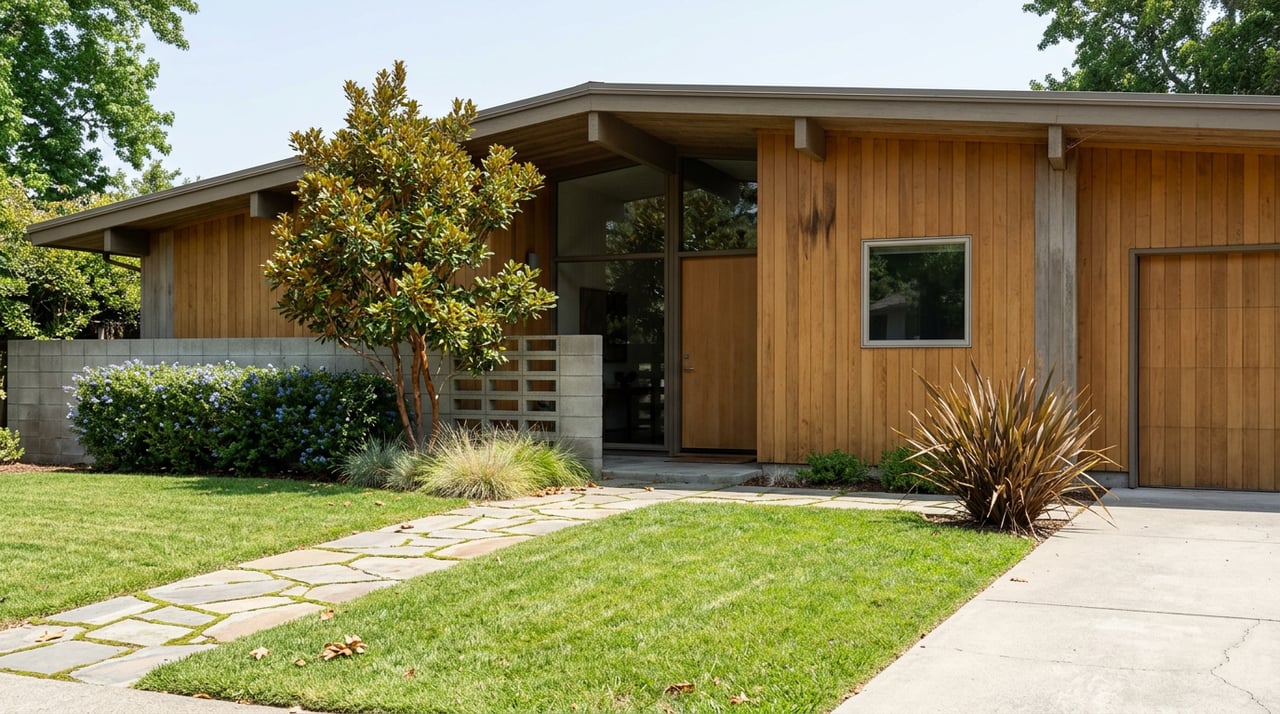
Terra Linda is known for its mid-century Eichler tract, the postwar ranch and post-and-beam homes that defined the neighborhood's original construction. That era of housing stock tends to be smaller-footprint and more uniformly priced, which pulls the median down and keeps it there.
Gerstle Park sits at the other end of the age spectrum. It dates to the late 1800s and is anchored by the park of the same name, the former site of the Lewis and Hannah Gerstle estate. It's also the neighborhood behind San Rafael PorchFest, an annual multi-stage music event that the Gerstle Park Neighborhood Association has organized since 2018, turning the historic, front-porch-heavy streets into a walk-through concert for a day. That kind of housing stock, older, architecturally varied, closer to downtown, carries a different price logic than a mid-century tract.
Peacock Gap and Dominican/Black Canyon post the highest medians for a straightforward reason: they're built around larger lots and amenity access that Terra Linda and Gerstle Park simply don't have. Peacock Gap includes the Peacock Gap Golf Club, two city parks, trail access into China Camp State Park, and recreational access to McNears Beach and the Peacock Gap Lagoon. You're not paying San Rafael's median for that. You're paying for a different category of property that happens to carry a San Rafael mailing address.
How One Sale Can Move a Month's Median
San Rafael sells somewhere between 30 and 45 homes in a typical month. That's a small enough sample that a single unusual transaction can visibly shift the citywide number. One local market report flagged exactly this kind of outlier: a 773-square-foot, one-bedroom condo at 12 Estates Court listed at $849,000, drew seven offers, and closed at $1,200,000, or $1,552 per square foot. The report's own read on it was blunt: that's the kind of outcome you'd expect in Mill Valley or San Francisco, not a typical San Rafael result.
One sale like that, dropped into a 30-to-45-home month, can nudge the median or the price-per-square-foot figure in a way that has nothing to do with where the broader market is headed. It's a reminder that a citywide monthly number is a snapshot of whoever happened to close escrow that month, not a stable read on value.
The Buyer's Market and the Seller's Market Share a Zip Code
The same fracture shows up in negotiating leverage. East San Rafael has been running as a genuinely competitive pocket, with a median of 24 days on market over the trailing three months into summer 2026 and hot homes selling around 9% over list. Back in February 2026, North San Rafael told a slower story: a median of 68 days on market and a 98.1% sale-to-list ratio, meaning the typical home there sold slightly under asking. Gerstle Park that same February sat in between on pace, 80 days on market, but closed at 100.6% of list, meaning it kept clearing over asking despite the slower timeline. San Pedro Peninsula moved faster that month, 30 days, at 98.9% of list.
Ask whether San Rafael is a buyer's market or a seller's market right now and the honest answer is that the question doesn't have a citywide answer. It has neighborhood-specific answers, and they don't point the same direction.
What Holds the Split in Place
Part of why these pockets don't drift toward one price over time is structural. San Rafael is home to the county's regional transit hub, the San Rafael Transit Center, and Golden Gate Ferry runs daily service to San Francisco from nearby Larkspur, which makes commute-adjacent neighborhoods like Montecito/Happy Valley and Gerstle Park feel more connected to downtown day to day than pockets further out.
Schools add another layer that's worth knowing rather than weighing. The San Rafael High School District operates as an open enrollment district for San Rafael residents, meaning students may choose between San Rafael High School and Terra Linda High School regardless of which side of the district they live on. That's a structural fact about flexibility, not a claim about one option being better than the other, and it's worth confirming directly with the district since boundaries and policies can shift.
None of this is going away, which means the spread between Terra Linda and Peacock Gap isn't a temporary market quirk correcting itself. It's the predictable result of different housing stock, different lot sizes, and different distances to the same handful of anchors, all reported up into one number that was never built to describe any single one of them well.
What This Means If You're Actually Comparing Marin Towns
If you're cross-shopping San Rafael against Mill Valley, Larkspur, or Novato, the citywide median is a starting point at best. The useful question isn't "what did San Rafael do this year." It's "what did the specific pocket I'm looking at do this year, and how does that compare to the days-on-market and sale-to-list ratio in the pocket next door." Those numbers tell you what you're actually competing against, whether you're negotiating from strength or writing a full-price offer just to be taken seriously.
That's the kind of comparison that benefits from someone who tracks these pockets month to month rather than someone quoting a headline figure. If you want to talk through what a specific San Rafael neighborhood, or a different Marin town entirely, actually looks like right now, Marc Machado is a phone call away. Reach Out Today.
This article is general information, not legal, tax or financial advice. Consult a qualified professional about your situation.